Free Printable Cartesian Graph Paper Templates
Cartesian graph paper is a type of grid that helps you plot points, draw graphs, and solve math problems. People often use it in algebra, geometry, science classes, and other projects that need coordinates.
Our printable Cartesian graph paper templates have clear horizontal and vertical lines to make graphing easy and accurate. You can download free PDF templates for classroom work, homework, practice, or personal projects.
Showing 1-4 of 4 records
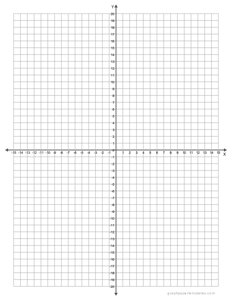
Coordinate Graph Paper
Free printable Coordinate graph paper can be a handy tool for a variety of tasks, from plotting the trajectory of a projectile to helping students visualize the properties of geometric shapes.
view detailscategory: Cartesian
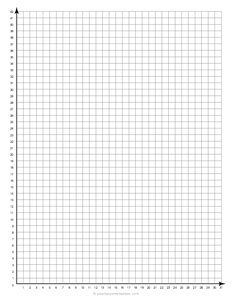
Single Quadrant Coordinate Plane
Download free printable single quadrant graph paper with positive X and Y axes. Perfect for beginners, coordinate plotting, math practice, and classroom activities.
view detailscategory: Cartesian
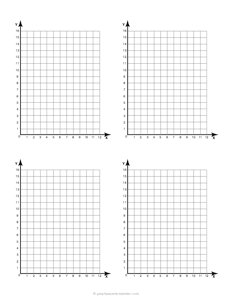
Single Quadrant Coordinate Plane - 4 Per Page
Download free printable single quadrant graph paper with 4 coordinate grids per page. Perfect for math practice, plotting points, worksheets, and classroom activities.
view detailscategory: Cartesian
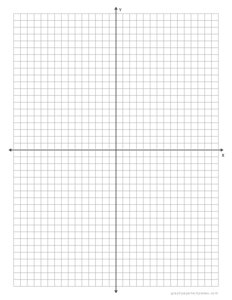
Printable Axis Graph Paper
Printable Graph Paper with axis is perfect for people working with math or physics problems. The gridlines and the axis on the paper can provide a visual aid when trying to line up numbers and equations.
view detailscategory: Cartesian
Cartesian graph paper is commonly used in math and science to plot points, draw graphs, and represent mathematical relationships in a visual format. It’s versatile and used in various fields like geometry, trigonometry, engineering, physics, and art.