Logarithmic Graph Paper
Logarithmic graph paper, also known as log paper, is a specialized type of paper with a grid designed to simplify the plotting of data on logarithmic scales. Our log paper collection will help with data visualization and analysis.
Our collection includes templates such as Log-Log and Semi-Log. Designed for professionals, scientists, engineers, and students, these log papers provide a powerful tool for plotting and interpreting data that follows exponential growth or decay.
Showing 1-2 of 2 records
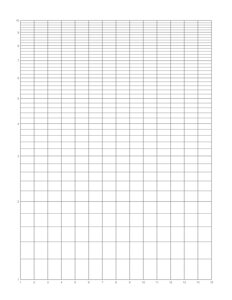
Semi-Log Graph Paper
Semi-log graph paper, also called semi-logarithmic or log linear graph paper, is a graphing paper with linear scales along the x-axis (horizontal axis) and logarithmic scales along the y-axis (vertical axis).
view detailscategory: Logarithmic
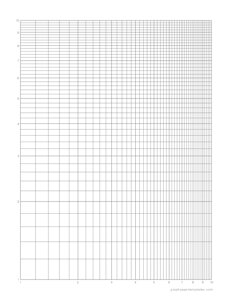
Log-Log Graph Paper
Free printable Log-log graph paper is a type of graph paper that uses a logarithmic scale on both the x-axis and y-axis. Simply download and print!
view detailscategory: Logarithmic
Key features of logarithmic graph paper include:
- Logarithmic Scales: The horizontal and vertical axes on logarithmic graph paper use logarithmic scales. This means that equal distances on the axes represent equal ratios rather than equal differences. Logarithmic scales are particularly useful for visualizing data that spans several orders of magnitude.
- Exponential Growth/Decay: Logarithmic graph paper is commonly used when dealing with data that exhibits exponential growth or decay. It facilitates a simpler representation of trends, making it easier to analyze and interpret data that spans various orders of magnitude.
- Decades and Cycles: The grid on logarithmic graph paper is often divided into cycles or decades, each representing a factor of 10. This facilitates easy identification of orders of magnitude on the graph.
- Applications: Logarithmic graph paper is frequently used in scientific and engineering fields, including physics, biology, chemistry, and electronics. It is valuable for plotting data related to exponential processes, such as population growth, radioactive decay, or signal amplitudes in electronics.
- Bode Plots: In electronics and control systems engineering, logarithmic graph paper is commonly used for creating Bode plots, which depict the frequency response of a system.
Logarithmic graph paper is a powerful tool for visualizing data that spans a wide range of values, especially when dealing with exponential relationships. It allows for a more intuitive representation of such data, making it easier to analyze and draw conclusions.