
Log-Log Graph Paper
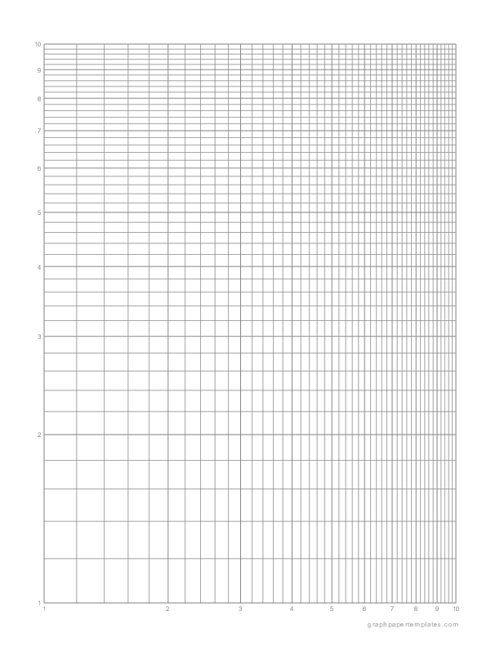
Paper Size: Letter
Format: PDF
Page Size: 8.5" x 11" - ( 216 mm x 279 mm )
Layout: Portrait / Vertical
Log-log graph paper is a type of graph paper that uses a logarithmic scale on both the x-axis and y-axis. This means that each unit on the axis represents a power of 10.
For example, on a log-log graph with an x-axis ranging from 1 to 10, the first unit would represent 10^1, or 10, while the second unit would represent 10^2, or 100.
If you are looking for linear scale on x-axis and logarithmic scale on y-axis, make sure to download log-log graph paper.
As a result, log-log graph paper is often used for plotting data that spans several orders of magnitude.
For instance, it can help track a population's growth over time or study the relationship between two variables that vary widely in value.
Where is log-log graph paper used?
This versatile graph paper is commonly used in science and engineering projects.
- Log-log graph paper is specially designed for use with logarithmic scales. Both the x-axis and y-axis are logarithmically scaled, making it ideal for graphing logarithmic functions.
- This type of graph paper is often used in physics and engineering applications where logarithmic scales are needed.
- Log-log graph paper can also be useful for plotting data that spans several orders of magnitude.
- By using a logarithmic scale, it is possible to compress a large range of values into a more manageable space.
As a result, log-log graph paper can be a valuable tool for visualizing data sets that would otherwise be difficult to comprehend.
Log-Log Graph Paper
You may also like:
Log-Log Graph Paper (2 Cycles Y-Axis)
Download multi-cycle log-log graph paper with multiple logarithmic cycles on single or both axes. Ideal for engineering, physics, and large-scale scientific data.
Semi-Log Graph Paper (2-Cycles on Y-Axis)
Print semi-log graph paper with two full logarithmic cycles on the Y-axis. Perfect for wide-range exponential data visualization and scientific graphs.
Semi-Log Graph Paper - X-Axis Logarithmic (A4)
Download printable A4 semi-log graph paper with a logarithmic X-axis and linear Y-axis. Useful for frequency plots, electronics and scientific data.
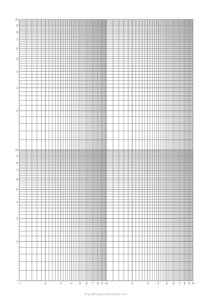
Log-Log Graph Paper - 4 Cycles (2×2) - A4
Download printable A4 log-log graph paper with a 2×2 four-cycle logarithmic grid. Great for math, engineering, physics and scientific plotting.
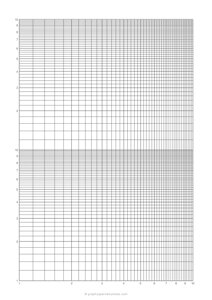
Log-Log Graph Paper - 2 Cycles Y-Axis (A4)
Printable A4 log-log graph paper with two logarithmic cycles on the Y-axis. Download the PDF for math, physics, engineering and scientific data.
